

Playbook for a Fed Pivot: Exploring Equity and Fixed Income Market Performance
Recent inflation data has tempered expectations for future Federal Reserve tightening, including a potential peak in the terminal rate near 5.0% in May or June of 2023. While the market has welcomed this news, history suggests the path to a Fed pivot could be volatile for stocks due to elevated inflation and interest rate risk. In this week’s Weekly Market Commentary, we explore historical equity and fixed income market performance surrounding a Fed pivot, including the prospect for solid stock performance in the back half of 2023.
A light at the end of the tightening tunnel
A light at the end of the Federal Reserve’s (Fed) tightening tunnel has recently emerged. Headline consumer inflation decelerated last month to 7.7% from 8.2% based on a year-over-year comparisons. Core inflation ticked down to 6.3% from 6.5%. While both headline and core inflation measures remain well above the Fed’s 2% inflation target, the data is most importantly heading in the right direction. Recent wholesale inflation tells a similar story of a peak in pricing pressures, which has been the expectation of the Strategic and Tactical Asset Allocation Committee (STAAC) at LPL Research.
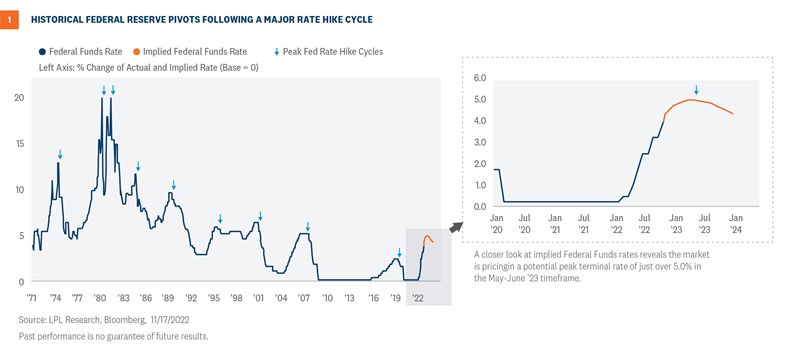
The lower trajectory in inflation has provided the market with much-needed visibility around Fed tightening coming to an end. As shown in the chart below, fed funds futures suggest the end of the rate hike cycle could come in May or June 2023. While there will be continued debate on the degree and timing of future rate hikes, the one thing most investors seem to agree on is that the terminal rate will likely peak sometime next year.
What does a Fed pivot mean for equity and fixed income markets?
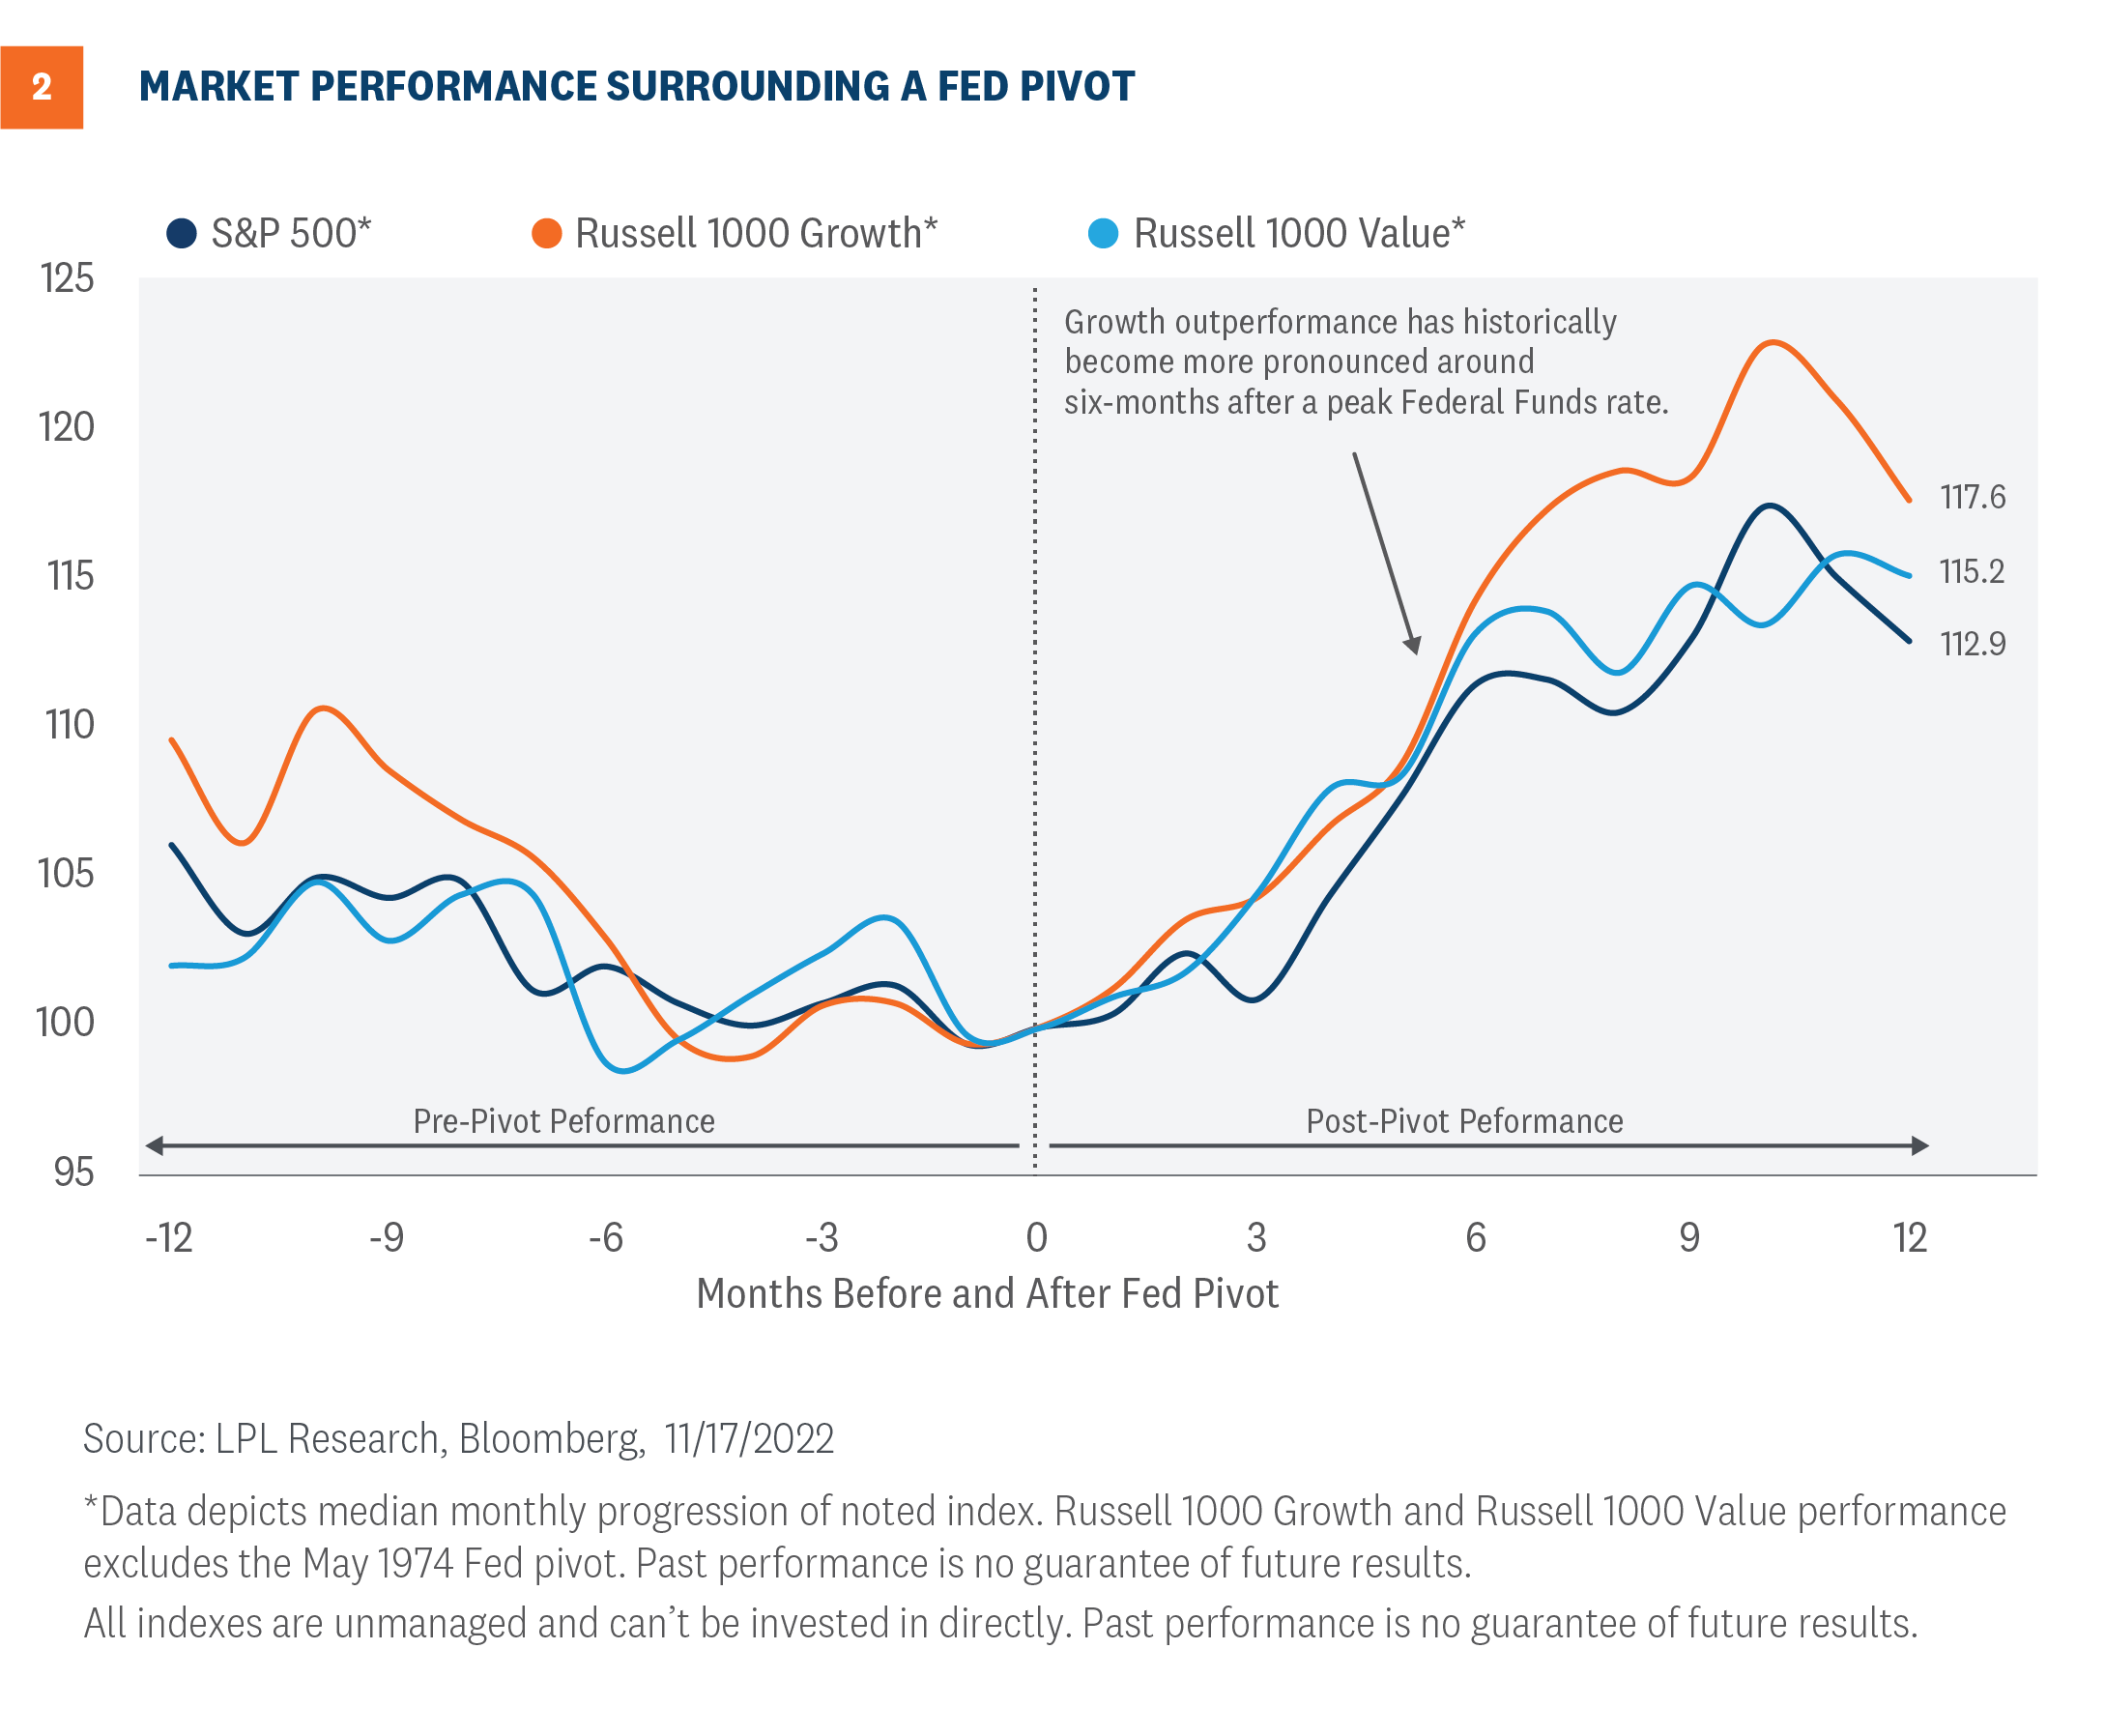
We researched prior rate hike cycles going back to the 1970s to identify historical Fed pivots. We defined a policy pivot as simply the end of a rate hike period marked by when the fed funds rate peaked, and not necessarily a shift in policy to rate cuts. In total we found nine other major tightening cycles that are highlighted on the previous page [Figure 1]. Based on these periods, we analyzed how equity markets behaved before and after each pivot. The chart below shows the average progression of the S&P 500, Russell 1000 Growth, and Russell 1000 Value indexes.
Pivot Playbook for Stocks:
- We found the S&P 500 historically trades lower into a Fed pivot by around 2% on average, based on a six-month lookback of pre-pivot performance. However, S&P 500 returns after a Fed pivot appear much more promising. The average peak return for the market has been around 17% across a 12-month timeframe. If you factor in the fed funds futures timeline of a May or June peak in the terminal rate, you could see around an 11% second half rally on the S&P 500 (based on six-month average returns).
- Growth outperformance has historically deteriorated as a Fed pivot approaches. Value tends to lead in the six-month window before a pivot. Sound familiar? The playbook for value outperformance was highlighted in our November 14th Weekly Market Commentary, which took a deeper dive into the factors driving value’s relative strength. As the commentary mentioned, “The Fed’s path forward on restrictive policy, guided by inflation and jobs data, will be a major contributor to whether value’s relative outperformance will continue.”
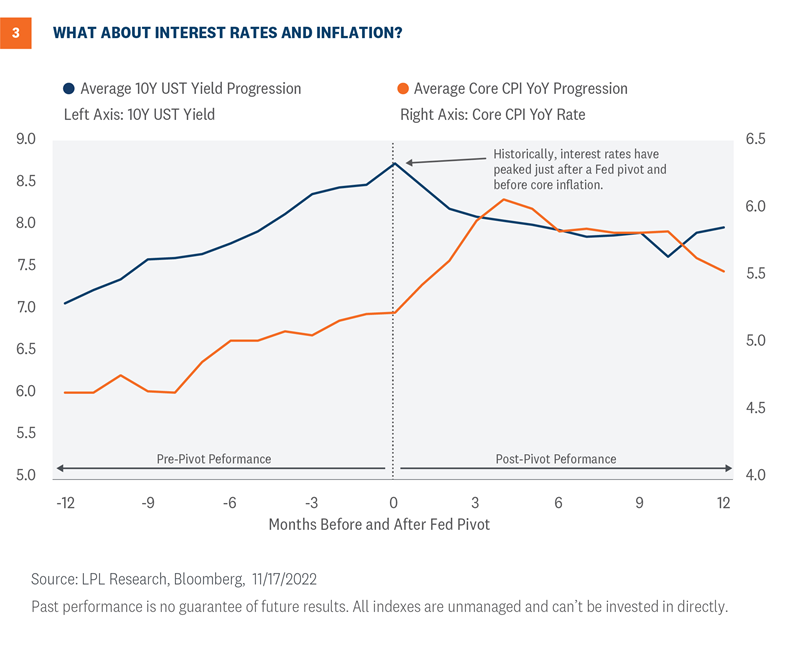
- Will growth stage a comeback? History shows growth and value trading higher but largely in line during the six-month period after a Fed pivot. However, as highlighted in [Figure 2], growth outperformance typically becomes more pronounced after the six-month post-pivot window. One of the catalysts driving growth’s relative strength likely stems from falling interest rates and inflation during this period [Figure 3].
Pivot playbook for rates and inflation:
The bear market in Treasuries this year quickly spilled over into U.S. equity markets. The sharp rise in yields proved to be too much for stocks to handle. Of course, Fed policy underpinned the parabolic jump in interest rates as they tried to combat inflation with unprecedented tightening. As we look ahead, the path of inflation will ultimately dictate the path for monetary policy, interest rates, and stocks.
- Despite some of the recent cooling in inflation data, history implies there is still upside inflation risk into next year. Prior rate hike cycles witnessed core inflation continue to climb until finally peaking four months after a Fed pivot. On average, core inflation also modestly dipped during a few periods within the three- to six-month window before a Fed pivot.
- Interest rate risk also appears elevated based on prior rate hike cycles. Benchmark 10-year Treasury yields have historically climbed higher until finally peaking near the Fed pivot point.
- Given the market’s sensitives around inflation and interest rates, this data implies stocks could be setting up for a volatile first half of 2023.
Conclusion
Recent inflation data has renewed optimism for a peak in the federal funds rate during the first half of 2023. We share in the market’s ‘over the hump’ enthusiasm but believe it could be a bumpy path for equity markets until there is a clear culmination of Fed tightening. While history may not repeat, it may rhyme with other major rate hike cycles, implying there is upside risk for inflation and interest rates. In addition, the S&P 500 has historically traded lower into a Fed pivot. The current backdrop of Fed tightening into next year should also continue to support value outperformance. With a potential peak in interest rates occurring near a Fed pivot, we suspect growth could make a comeback during the back half of 2023.
Adam Turnquist, CMT, Chief Technical Strategist, LPL Financial
Marc Zabicki, CFA, Chief Investment Officer, LPL Financial