

A Closer Look at Commercial Real Estate Market
The commercial real estate (CRE) market has recently captured the spotlight after being flagged as the next potential shoe to drop following last month’s banking turmoil. While rising rates have weighed on financing costs and the recent bank failures will make lending more restrictive, the post-pandemic world has produced structural changes that will likely weigh on the sector, especially within the retail and office segments. Banks, especially smaller cap regionals, are most exposed to CRE if credit cracks continue to widen.
Background
The troubles brewing in the CRE market have percolated since the pandemic—especially for the office and retail segments. Lockdowns and closures of most major cities brought both work and shopping into the homes of most Americans.
As the services sector shut down, consumers opted to shop online for goods. The shift in spending habits ultimately reduced the need for brick-and-mortar stores during an unfortunate period when many businesses closed their doors. As we all learned in economics, reduced demand and increased supply lowers the price equilibrium for the retail CRE sector.
The office sector of CRE is facing a similar supply and demand imbalance. With what many believed was a temporary solution to office closures, work-from-home policies have continued since the pandemic as employees now opt for remote work by choice rather than necessity. This structural shift has reduced demand for office space and pushed vacancy rates to record highs at the end of 2022 (Figure 1, shaded area).
The Russell 3000 Office REIT Index shown in Figure 1, comprised of companies owning, operating, developing, or leasing office buildings, is down around 60% from its pre-pandemic highs. Nearly half of those losses came during the banking turmoil last month, pushing the index back down to record lows.
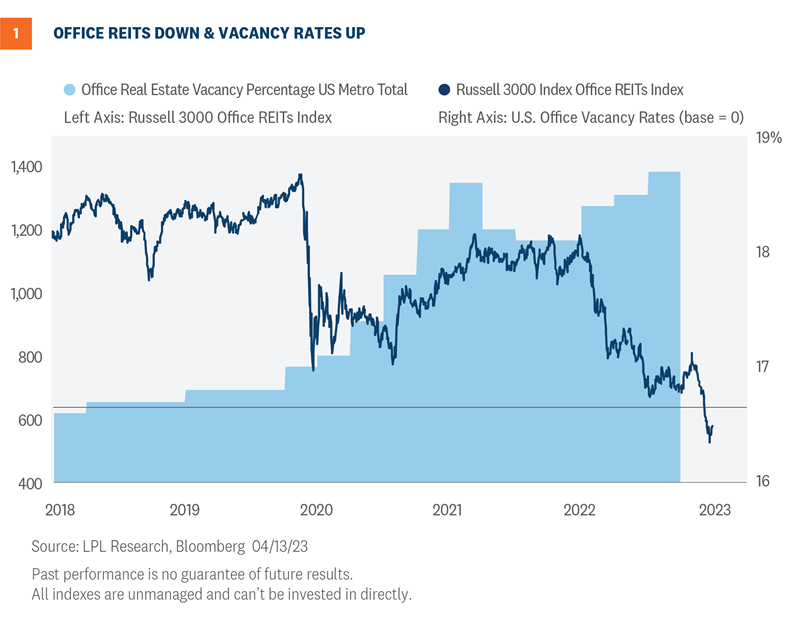
While the market has clearly priced in a lot of negativity for office REITs, the upward trajectory of vacancy rates implies there could be more downside risk ahead. Furthermore, higher frequency data shows there is still a long way to go for office occupancy rates to normalize back to pre-pandemic levels—an unlikely event given the proliferation of work from home policies across corporate America.
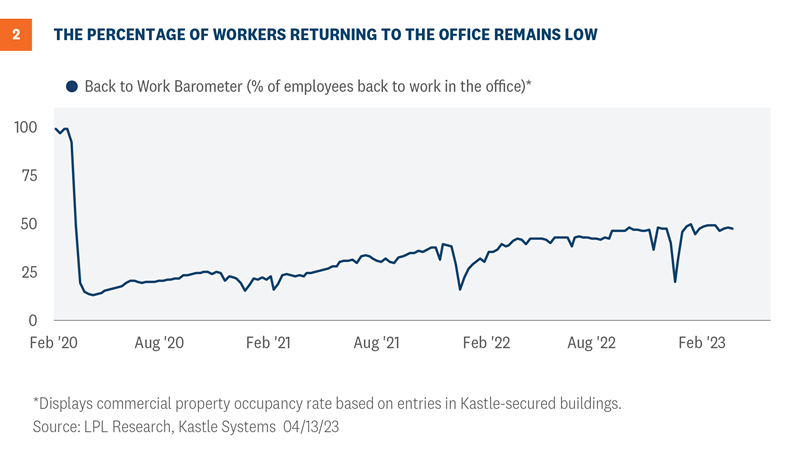
The Back to Work Barometer shown in Figure 2 shows the weekly occupancy rate based on data from Kastle Access Control Systems. The data includes app, keycard, and fob usage for 2,600 buildings and 41,000 businesses across 47 states. While the trend of employees returning back to the physical office is improving, the percentage remains well below pre-pandemic levels.
Where is the risk
Credit and liquidity are the primary risks impacting the CRE market right now. While ownership of CRE debt is relatively diverse, banks hold 61% of all CRE mortgages, according to FactSet. Credit spreads within investment grade commercial mortgage-backed securities, which rise in conjunction with default risk, have roughly doubled over the last 12 months. Elevated credit risk, constrained lending due to the fallout from the recent banking turmoil, and declining commercial property values have exacerbated both credit and liquidity concerns for the CRE market. This backdrop will negatively impact refinancing costs as CRE debt comes due. For office REITs, there is an estimated $12.5 billion in total debt maturing in 2023 and 2024 with an average coupon of around 4.0%. With yields and credit risk substantially higher since these loans originated, refinancing this debt will be more costly and difficult given increased lending standards.
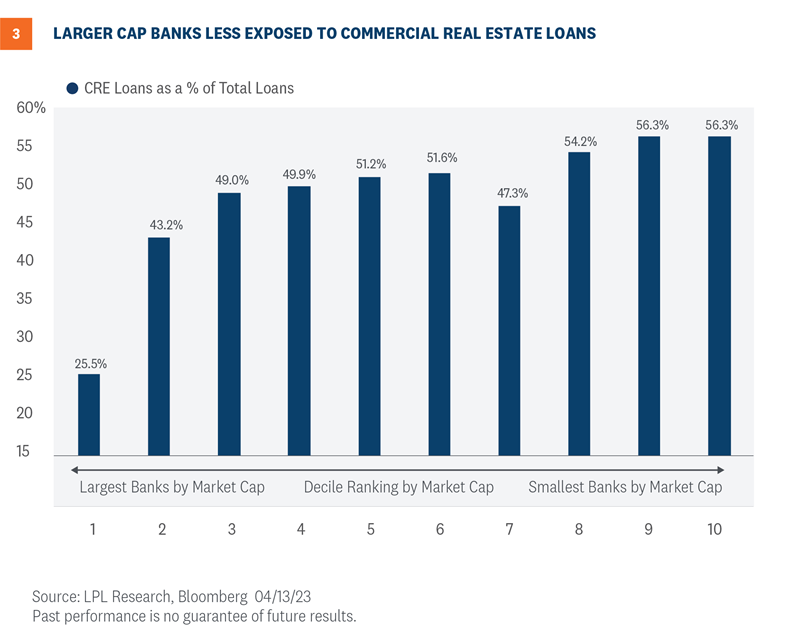
As noted above, banks are the largest holders of CRE loans. However, the proportion of CRE debt to total loans varies at the market cap level. In general, larger banks have less exposure as a percentage of their total loans compared to smaller cap regional banks. For example, CRE loans comprise around 25% of all loans for the largest U.S. banks, shown in Figure 3 under the first decile grouping. This compares to smaller cap banks that have a CRE to total loan ratio of over 50%. What does this mean for investors? Going up in market cap within the banking space should help reduce CRE risk.
Credit cracks emerging
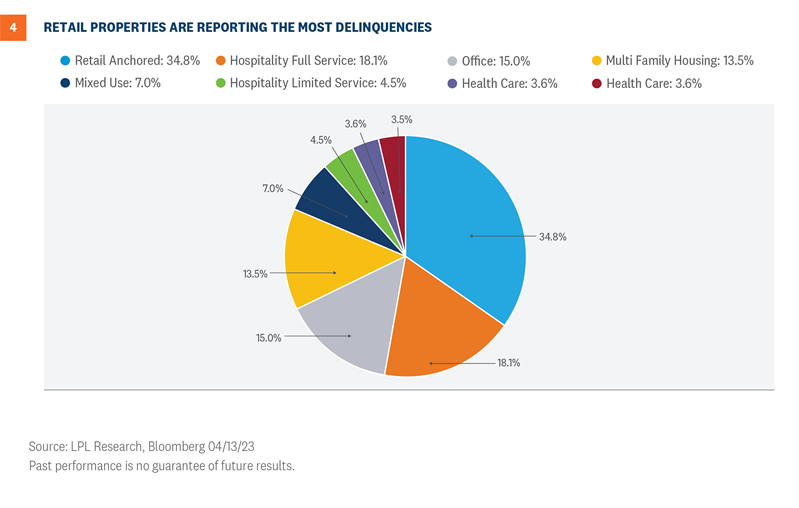
Historically low interest rates helped cover some of the credit cracks within the CRE space after the pandemic. However, after last year’s meteoric rise in interest rates, delinquency rates have begun to rise, especially within the retail sector. As shown in Figure 4, roughly 35% of the loans pooled in anchored retail commercial mortgage-backed securities (CMBS) have reported delinquent payments that exceed three months. Delinquent payments that exceed three months within the hospitality full service and office segments CMBS pools are at 18.1% and 15.0%, respectively.
Silver lining
The silver lining is that capitalization (cap) rates, which are used to estimate the return on investment for properties, have climbed to over 9% for the office space segment, marking nearly a 3.0% increase since 2021. Most retail cap rate categories are up around 2% since 2021. If the Federal Reserve (Fed) ends its rate hiking cycle and inflation continues to track lower, and the U.S. economy avoids a recession, attractive cap rates could provide some downside support as investors search for higher yields.
Summary
The commercial real estate market continues to face challenges from structural changes in the wake of the pandemic. Rising interest rates and the recent banking turmoil have shed new light on credit cracks developing in the retail and office space. Smaller-cap regional banks face increased exposure to the sector based on higher CRE loan concentrations. While the market has clearly priced in a lot of negativity for office REITs, rising delinquency rates and the upward trajectory of vacancy rates implies there could be more downside risk ahead.
Investment outlook
Stocks may not get much support from earnings in the near term as the malaise continues. However, we do expect the market to benefit from the end of the Fed’s rate hiking campaign—likely in May. Higher interest rates may challenge stock valuations this year, but we still see potential for additional gains for stocks over the next nine months.
LPL Research remains comfortable with its year-end S&P 500 fair value target of 4,300–4,400. While that target was set based on a price-to-earnings ratio (P/E) of 18 and a 2024 EPS estimate of $240, the P/E may be a bit higher and the earnings number a bit lower when all the results are in.
The LPL Research Strategic and Tactical Asset Allocation Committee (STAAC) recommends a slight overweight allocation to equities, narrowly favors value over growth, has moved to benchmark-level exposure for small and large caps, has the industrials sector as its top pick, and has warmed up to the technology sector, where the overall view is currently neutral, but the technical analysis picture has improved significantly this year.
Within fixed income, the Committee recommends an up-in-quality approach with a benchmark weight to duration. We think core bond sectors (U.S. Treasuries, Agency mortgage-backed securities (MBS), and short-maturity investment grade corporates) are currently more attractive than plus sectors (high-yield bonds and non-U.S. sectors) with the exception of preferred securities, which look attractive after having recently sold off due to the banking stresses.
Adam Turnquist, CMT, Chief Technical Strategist
IMPORTANT DISCLOSURES
This material is for general information only and is not intended to provide specific advice or recommendations for any individual. There is no assurance that the views or strategies discussed are suitable for all investors or will yield positive outcomes. Investing involves risks including possible loss of principal. Any economic forecasts set forth may not develop as predicted and are subject to change.
References to markets, asset classes, and sectors are generally regarding the corresponding market index. Indexes are unmanaged statistical composites and cannot be invested into directly. Index performance is not indicative of the performance of any investment and do not reflect fees, expenses, or sales charges. All performance referenced is historical and is no guarantee of future results.
Any company names noted herein are for educational purposes only and not an indication of trading intent or a solicitation of their products or services. LPL Financial doesn’t provide research on individual equities.
All information is believed to be from reliable sources; however, LPL Financial makes no representation as to its completeness or accuracy.
US Treasuries may be considered “safe haven” investments but do carry some degree of risk including interest rate, credit, and market risk. Bonds are subject to market and interest rate risk if sold prior to maturity. Bond values will decline as interest rates rise and bonds are subject to availability and change in price.
The Standard & Poor’s 500 Index (S&P500) is a capitalization-weighted index of 500 stocks designed to measure performance of the broad domestic economy through changes in the aggregate market value of 500 stocks representing all major industries.
The PE ratio (price-to-earnings ratio) is a measure of the price paid for a share relative to the annual net income or profit earned by the firm per share. It is a financial ratio used for valuation: a higher PE ratio means that investors are paying more for each unit of net income, so the stock is more expensive compared to one with lower PE ratio.
Earnings per share (EPS) is the portion of a company’s profit allocated to each outstanding share of common stock. EPS serves as an indicator of a company’s profitability. Earnings per share is generally considered to be the single most important variable in determining a share’s price. It is also a major component used to calculate the price-to-earnings valuation ratio.
All index data from FactSet.
There is no guarantee that a diversified portfolio will enhance overall returns or outperform a non-diversified portfolio. Diversification does not protect against market risk.
Asset allocation does not ensure a profit or protect against a loss.
A CDS contract is a derivative product that protects the CDS buyer from a credit default of the underlying security. Credit risk is transferred to the seller of the CDS contract, who requires a premium for the protection. As credit risk increases or decreases, the contract premium goes up and down, similar to an insurance policy.
A typical notional on a CDS is in the range $10-$20 mm. CDSs have a stated maturity (typical terms are 3, 5, 7, and 10 years), with the most liquid point at 5 years. Typically, credit default swaps are the domain of institutional investors.
Preferred stock dividends are paid at the discretion of the issuing company. Preferred stocks are subject to interest rate and credit risk. As interest rates rise, the price of the preferred falls (and vice versa). They may be subject to a call feature with changing interest rates or credit ratings.
The fast price swings in commodities will result in significant volatility in an investor’s holdings. Commodities include increased risks, such as political, economic, and currency instability, and may not be suitable for all investors.
Value investments can perform differently from the market as a whole. They can remain undervalued by the market for long periods of time.
The prices of small cap stocks are generally more volatile than large cap stocks.
International investing involves special risks such as currency fluctuation and political instability and may not be suitable for all investors. These risks are often heightened for investments in emerging markets.
For a list of descriptions of the indexes and economic terms referenced in this publication, please visit our website at lplresearch.com/definitions.
This research material has been prepared by LPL Financial LLC.
Securities and advisory services offered through LPL Financial (LPL), a registered inv estment advisor and broker -dealer (member FINRA/SIPC). Insurance products are offered through LPL or its licensed affiliates. To the extent you are receiving investment a dvice from a separately registered independent investment advisor that is not an LPL affiliate, please note LPL makes no representation with respect to such entity.
| Not Insured by FDIC/NCUA or Any Other Government Agency | Not Bank/Credit Union Guaranteed | Not Bank/Credit Union Deposits or Obligations | May Lose Value |
RES-1479306-0323 | For Public Use | Tracking #1-05367599 (Exp. 04/24)